Polar offers a professional metrics dashboard out of the box. So you can stay focused on increasing revenue vs. how to measure it.
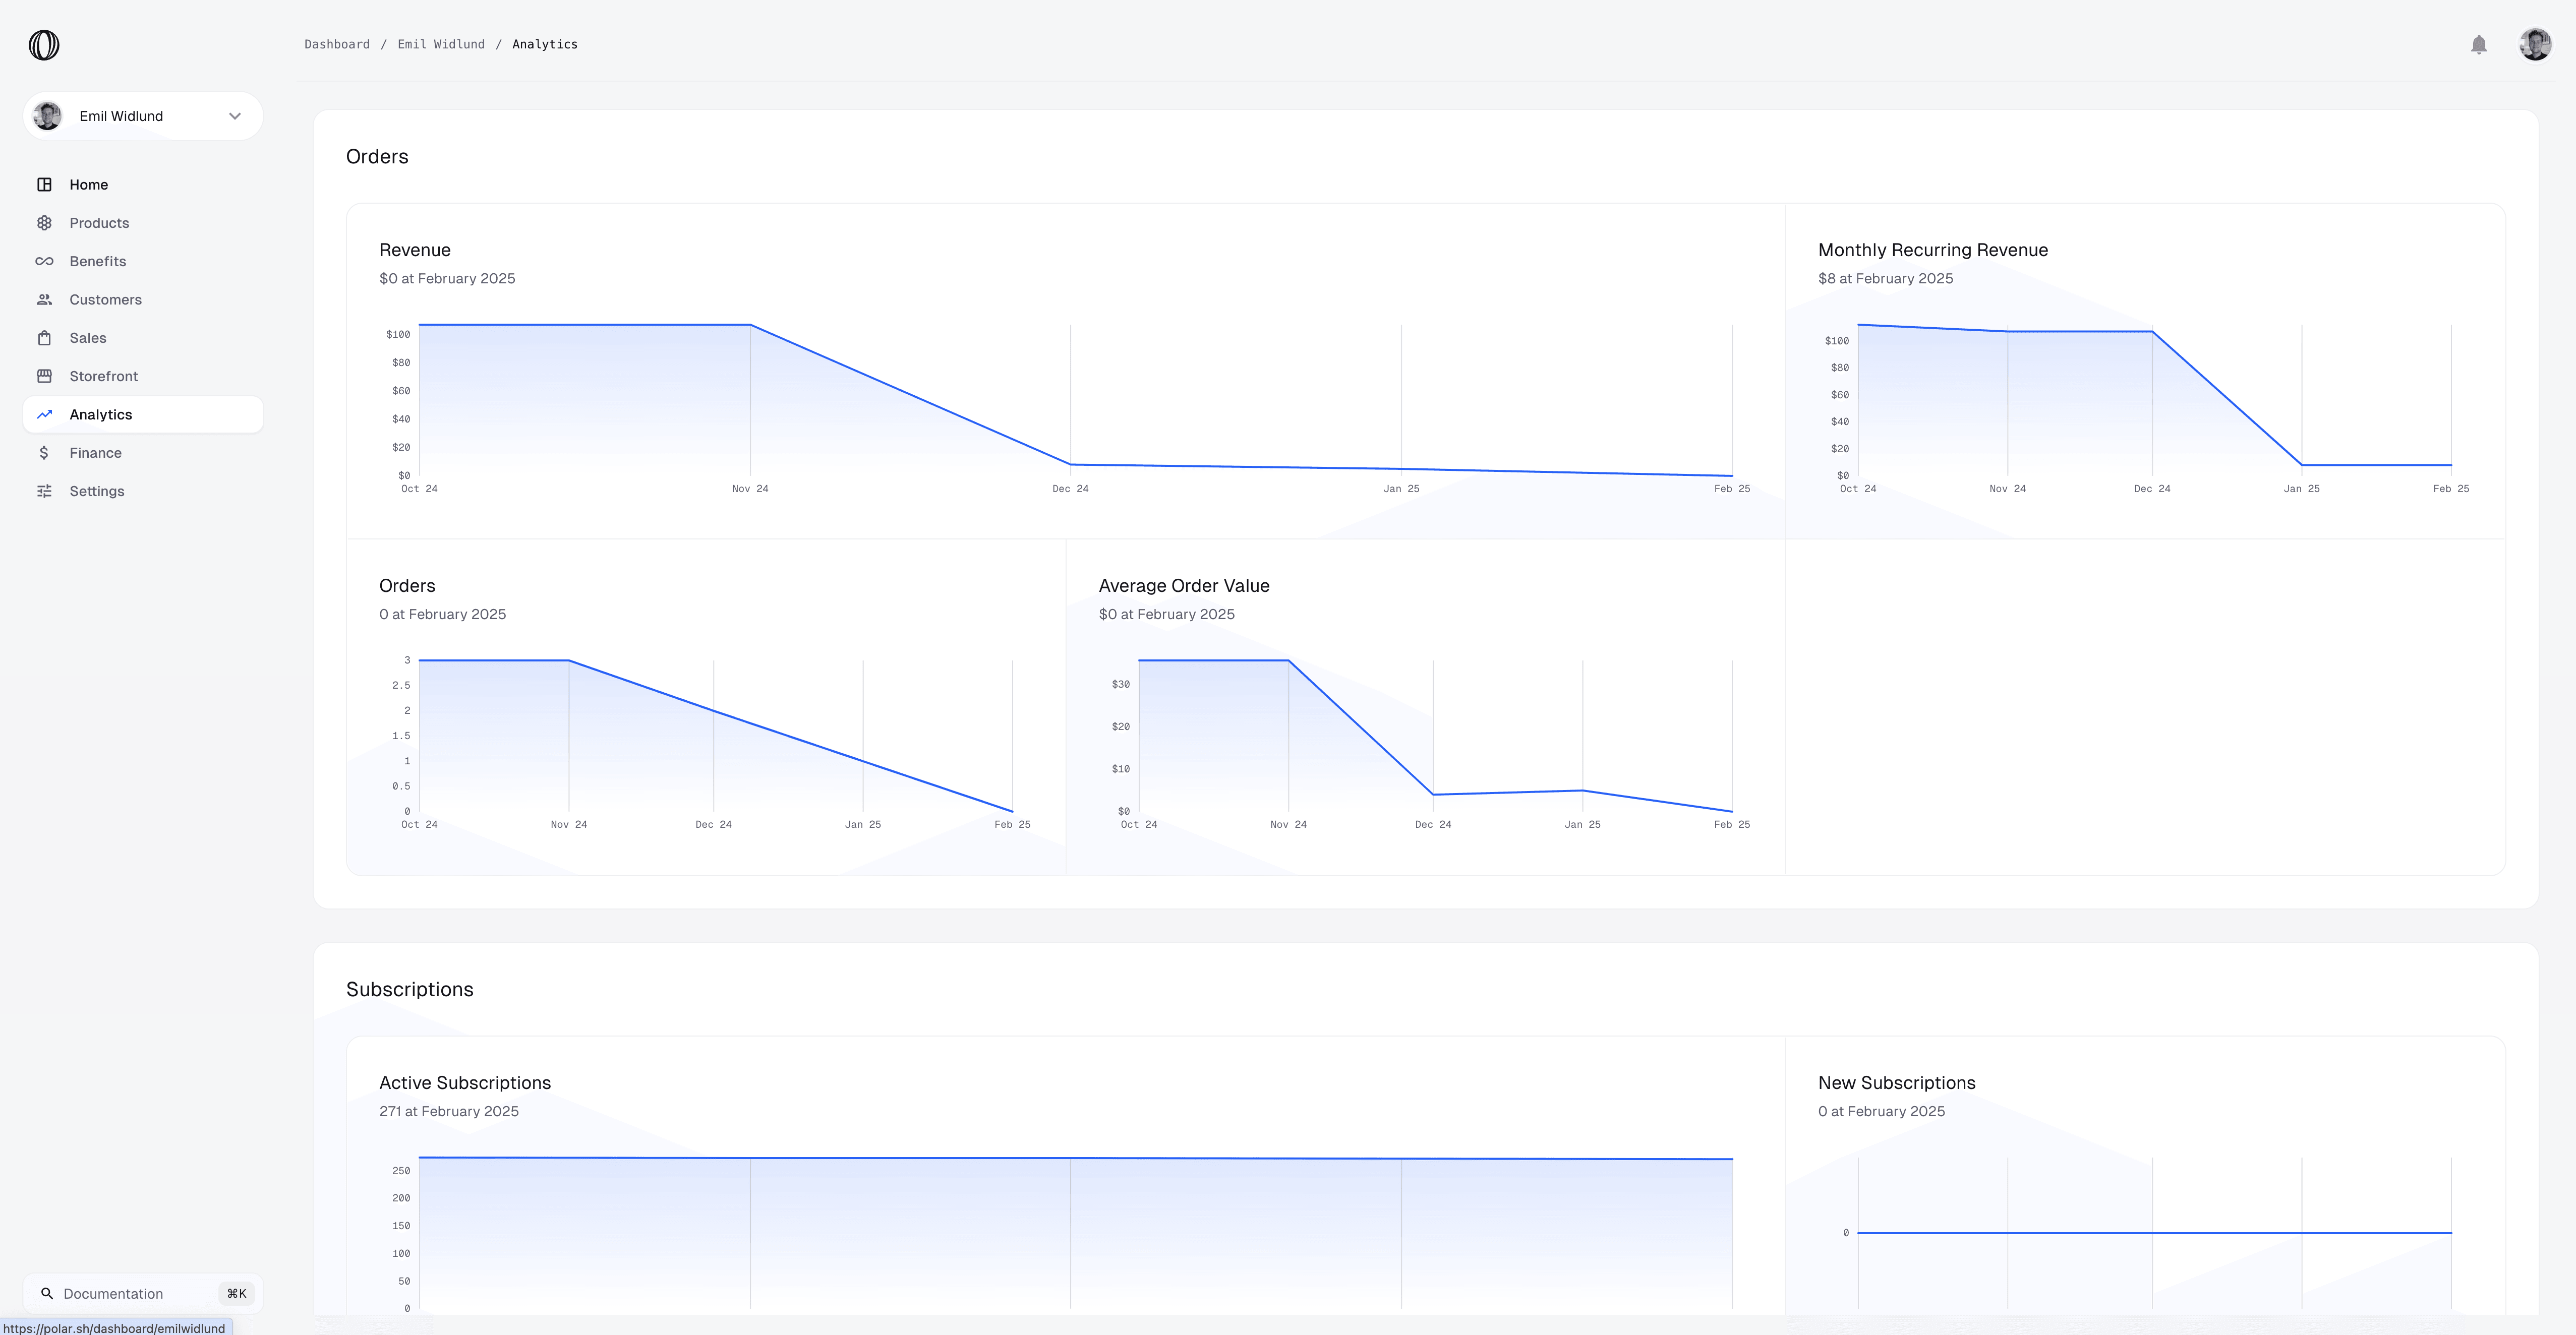
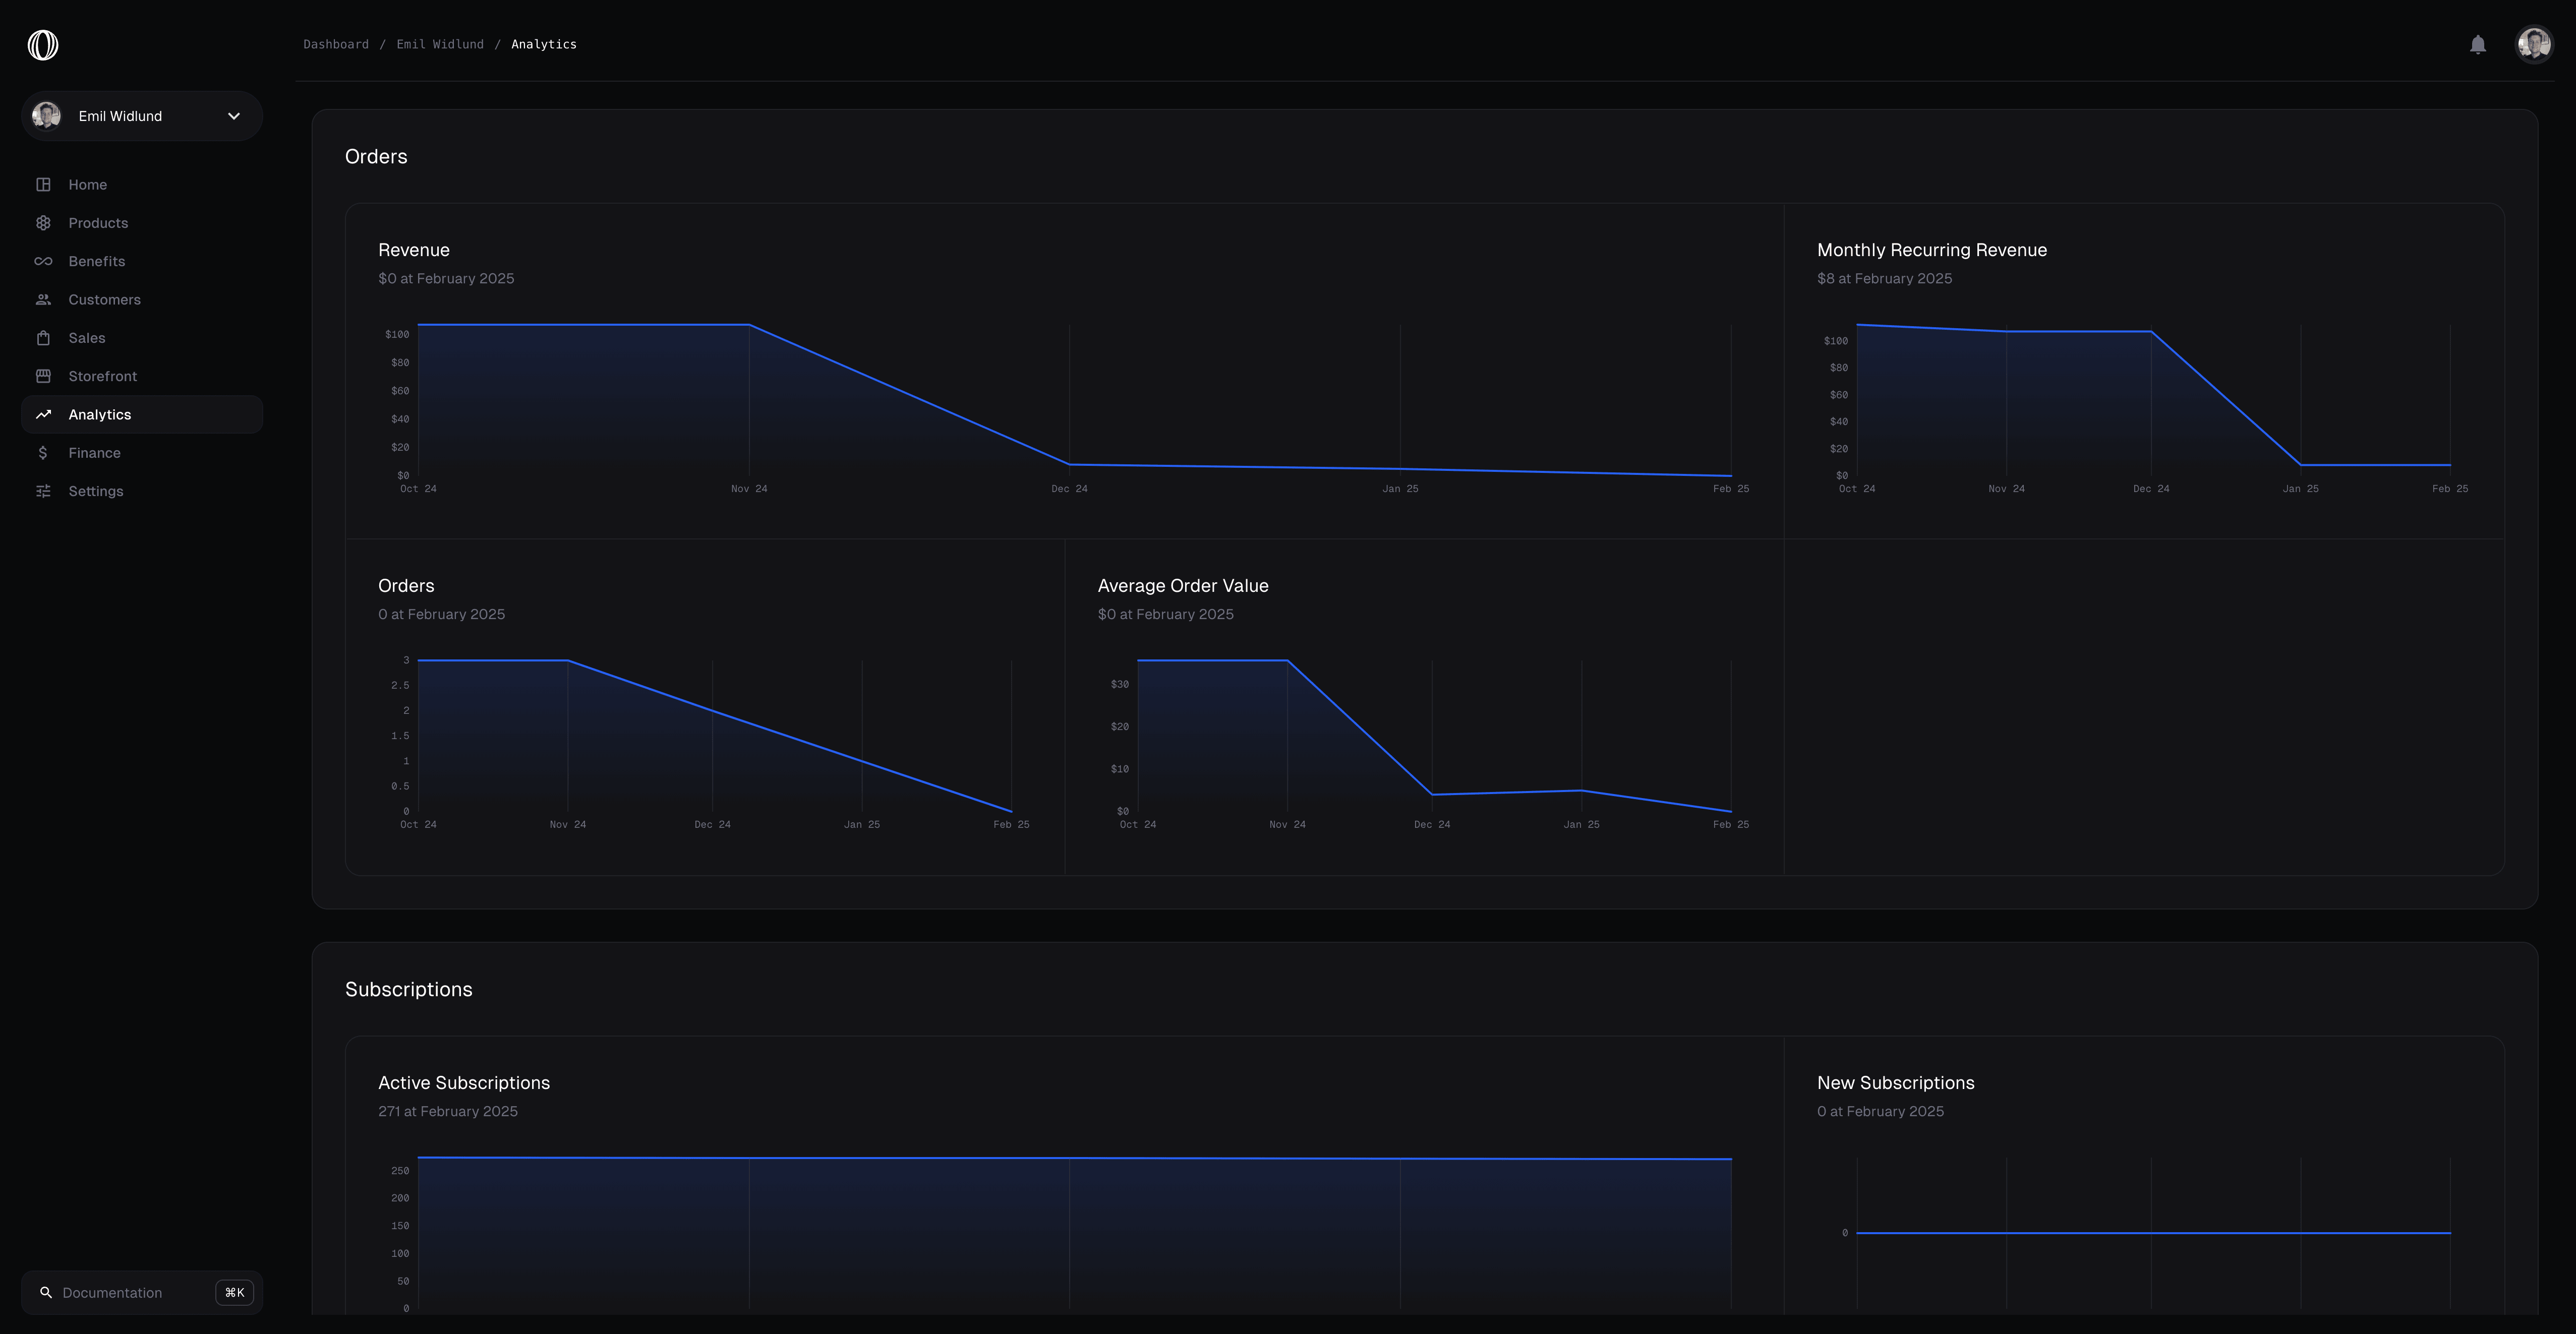
Missing any metrics? Let us know so we can add it.
You can easily slice and dice metrics with the filters below.
Change the time period in the X-axis to one of:
You can choose a date range to view all metrics for.
By default metrics reflect the total across all products. However, you can specify individual products or subscription tiers to filter metrics by.
How much revenue you’ve earned before fees.
How many product sales and subscription payments have been made.
The average earning per order, i.e revenue / orders.
Amount of products sold.
Amount of revenue earned from products.
Amount of new subscriptions.
Amount of revenue earned from new subscriptions.
Amount of renewed subscriptions.
Amount of revenue earned from renewed subscriptions.
Amount of active subscriptions (new + renewed)
Amount of revenue earned from active subscriptions.
Number of created checkouts.
Number of successful checkouts, i.e. checkouts that lead to a new order or subscription.
The percentage of successful checkouts out of all created checkouts.